Medicare Part D Charts
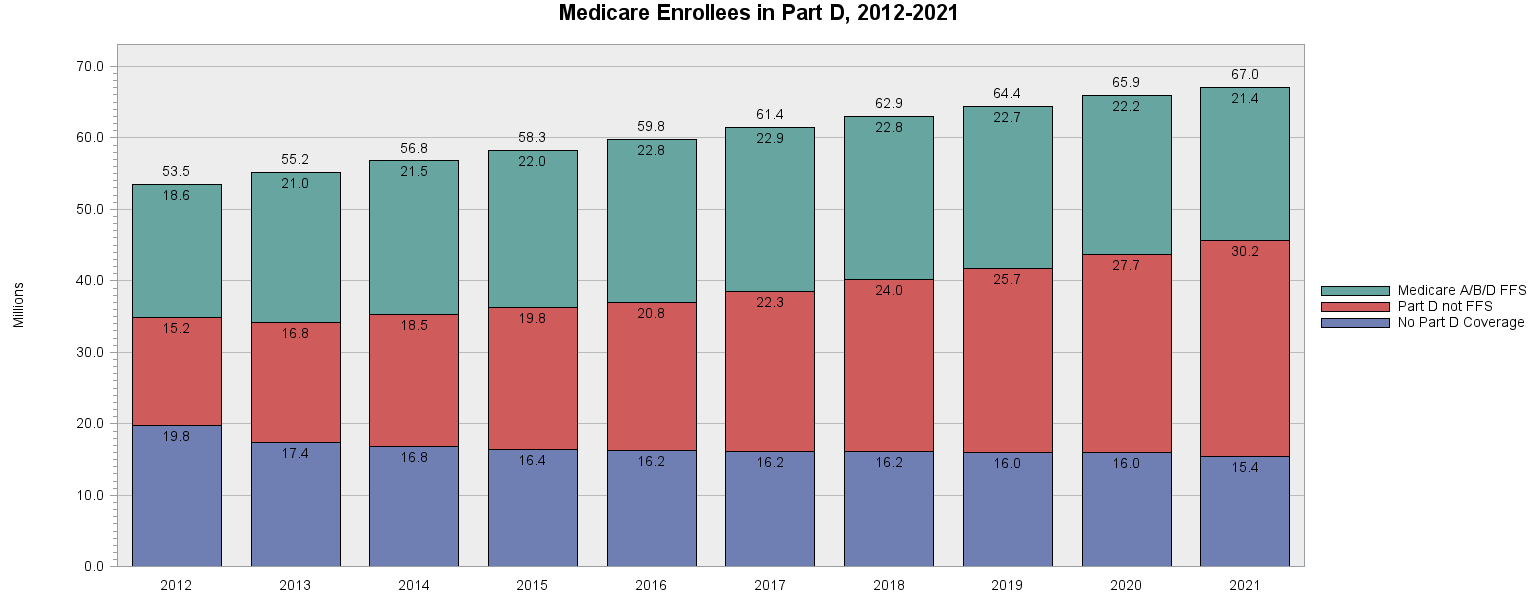
Medicare Enrollees in Part D, 2013–2022
Description: The number and proportion of Medicare beneficiaries who have elected to purchase the Medicare Part D drug benefit has increased over time. Enrollees may choose either a stand-alone prescription drug plan (PDP) or a managed care plan (i.e., Medicare Advantage-with Prescription Drug [MA-PD]), which includes wrap around medical coverage. MA coverage is not fee-for-service (FFS), which means that in general, the Medicare A and B claims are observable for the MA enrolled subgroup starting with the 2015 encounter service data files.
Technical Notes: Counts include all Medicare beneficiaries who were enrolled in Medicare on or after January 1 of the year. Medicare Part D coverage includes anyone with one month or more of Part D during the year. FFS Medicare A/B/D coverage indicates the beneficiary had 11 or 12 months of both Part A and Part B FFS coverage (or for persons who died during the year, from January 1 until the month before death occurred), in addition to at least one month of Part D coverage. The Part D and not FFS category does not reflect the percent with MA-PD coverage; it includes beneficiaries with fewer than 11 months FFS coverage.
Chart Date: August 2024
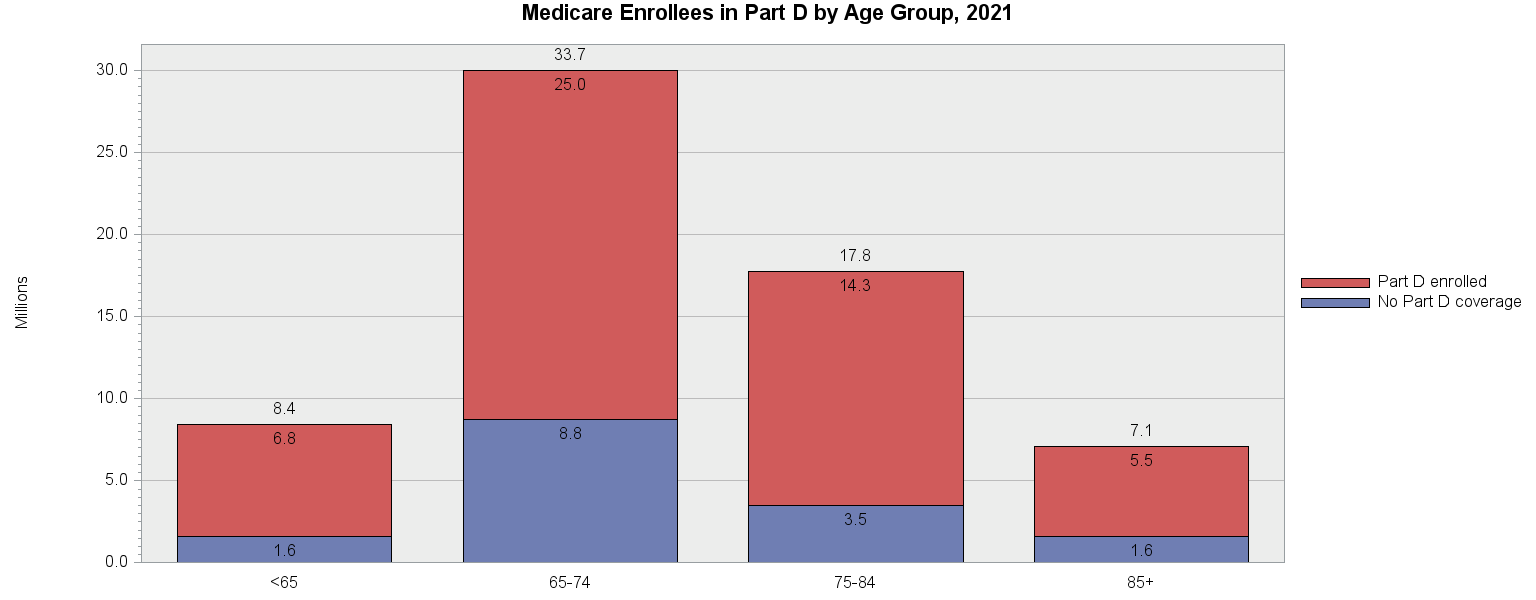
Medicare Enrollees in Part D by Age Group, 2022
Description: The number and proportion of Medicare beneficiaries who have elected to purchase the Medicare Part D drug benefit varies by age of the beneficiary. The 65–74-year-old age group comprises the largest group enrolled in Medicare Part D. Within the age groupings, 81.7% percent of beneficiaries younger than 65 years of age were enrolled in Part D in 2022, compared to 75.0% of beneficiaries in the 65–74-year age group, 80.7% of beneficiaries in the 75–84-year age group, and 78.4% in the oldest age grouping.
Technical Notes: Medicare Part D coverage includes anyone with one month or more of Part D during the year. Age is calculated based on the age of the Medicare beneficiary as of December 31. If the beneficiary expired, the age is calculated based on age at time of death.
Chart Date: August 2024
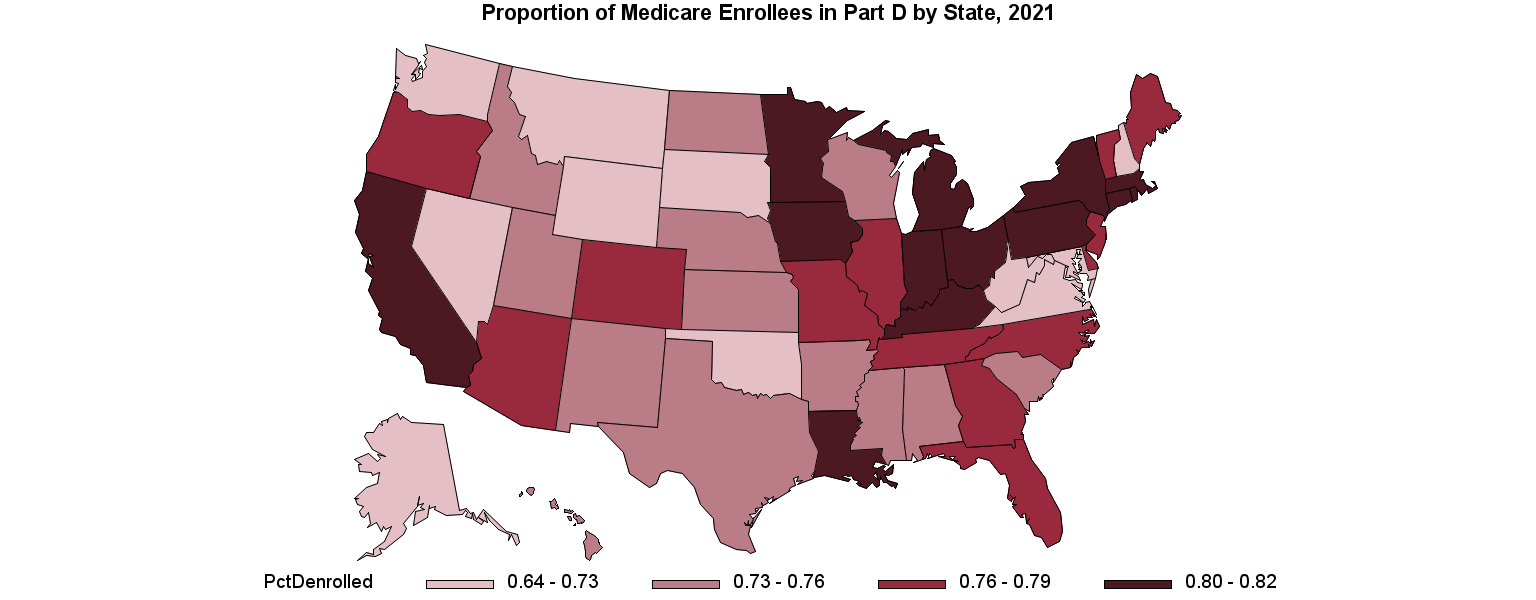
Proportion of Medicare Enrollees in Part D by State, 2022
Description: The proportion of Medicare beneficiaries enrolled in Part D varies by state. There were a total of 68.2 million Medicare beneficiaries in 2022 and 77.7% overall were enrolled in Part D. Alaska had the smallest proportion of Medicare beneficiaries enrolled in Part D (60.3%) and Michigan had the largest proportion (78.0%).
Technical Notes: Medicare beneficiaries who were enrolled in Medicare on or after January 1 of the year are counted. Medicare Part D coverage includes anyone with one month or more of Part D during the year.
Chart Date: August 2024
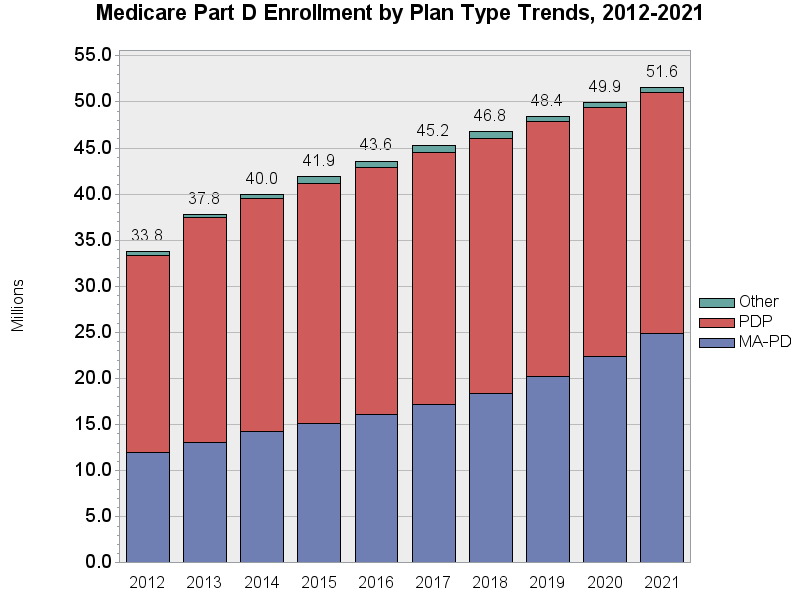
Medicare Part D Enrollment by Plan Type, 2013–2022
Description: Medicare Part D enrollees may choose either a stand-alone prescription drug plan (PDP) or a managed care drug plan which includes wrap around medical coverage (i.e., Medicare Advantage [MA-PD]). MA-PD coverage is not fee-for-service (FFS), which means that the Medicare A and B claims are not observable for this subgroup until 2015 when encounter service data became available. The proportion of Part D enrollees in managed care has increased from 34.6% in 2013 to 51.2% in 2022.
Technical Notes: Medicare Part D coverage includes anyone with one month or more of Part D during the year. The "Other" plan type includes employer sponsored plans, national Program of All-Inclusive Care for the Elderly (PACE) and demonstrations; in addition, "Other" includes employer direct plans.
Chart Date: August 2024
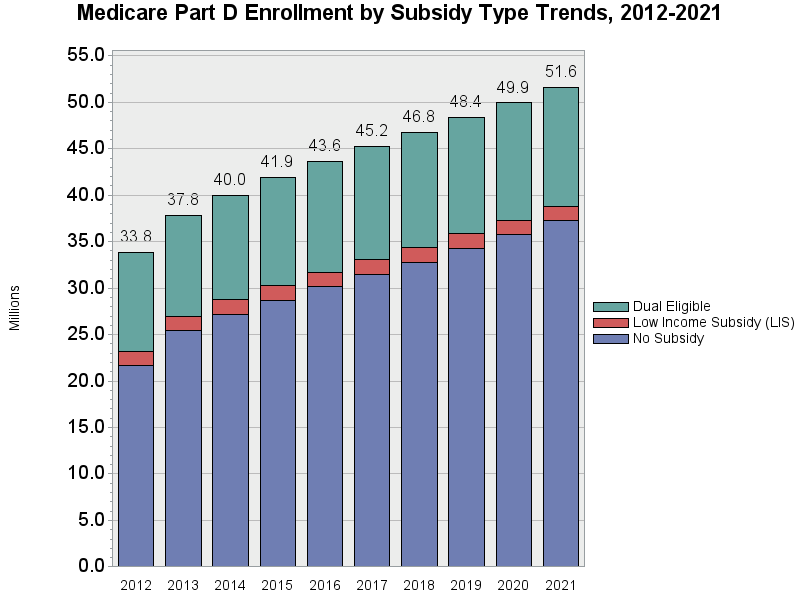
Medicare Part D Enrollment by Subsidy Type, 2013–2022
Description: The proportion of Medicare Part D enrollees classified as dually eligible (i.e., enrolled in both Medicare and Medicaid) has declined slightly from 28.8% in 2013 to 25.1% in 2022. This decrease in the proportion is likely due to an influx of beneficiaries without any subsidy for Part D electing to purchase the benefit, since the number of dually-eligible enrollees in Part D has increased from 10.9 million in 2013 to 13.3 million in 2022.
Technical Notes: Medicare Part D coverage includes anyone with one month or more of Part D during the year. Classification used the state-reported dual status variable to determine dual eligibility (DE; with a full low-income subsidy [LIS]) and the cost-share group variable to determine non-dual eligible LIS status, where any month of DE or LIS resulted in such a classification.
Chart Date: August 2024
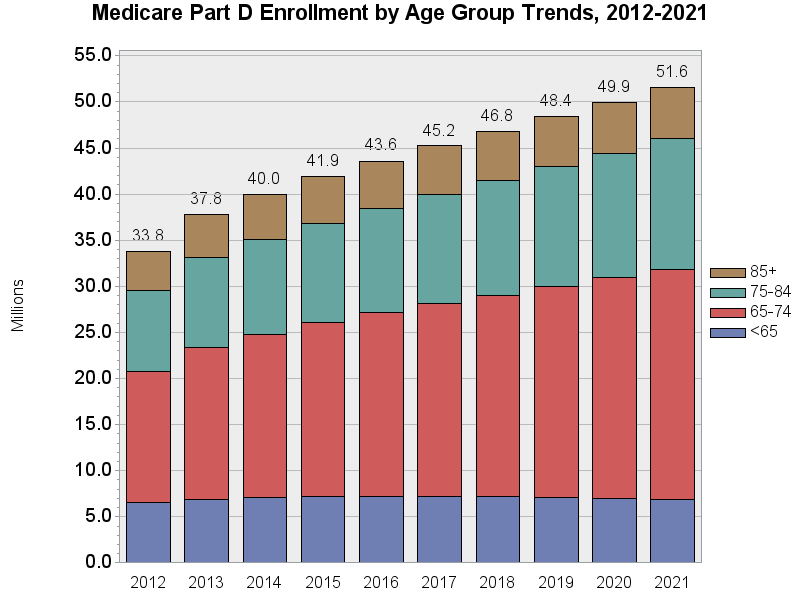
Medicare Part D Enrollment by Age Group, 2013–2022
Description: The population aged 65–74 years accounts for the largest proportion of the Part D enrollees. The proportion of Part D enrollees comprised of 65–74-year-olds has increased over time — from 43.5% in 2013 to 48.3% of the Part D enrolled population in 2022.
Technical Notes: Medicare Part D coverage includes anyone with one month or more of Part D during the year. Age is calculated based on the age of the Medicare beneficiary as of December 31. If the beneficiary expired, the age is calculated based on age at time of death.
Chart Date: August 2024
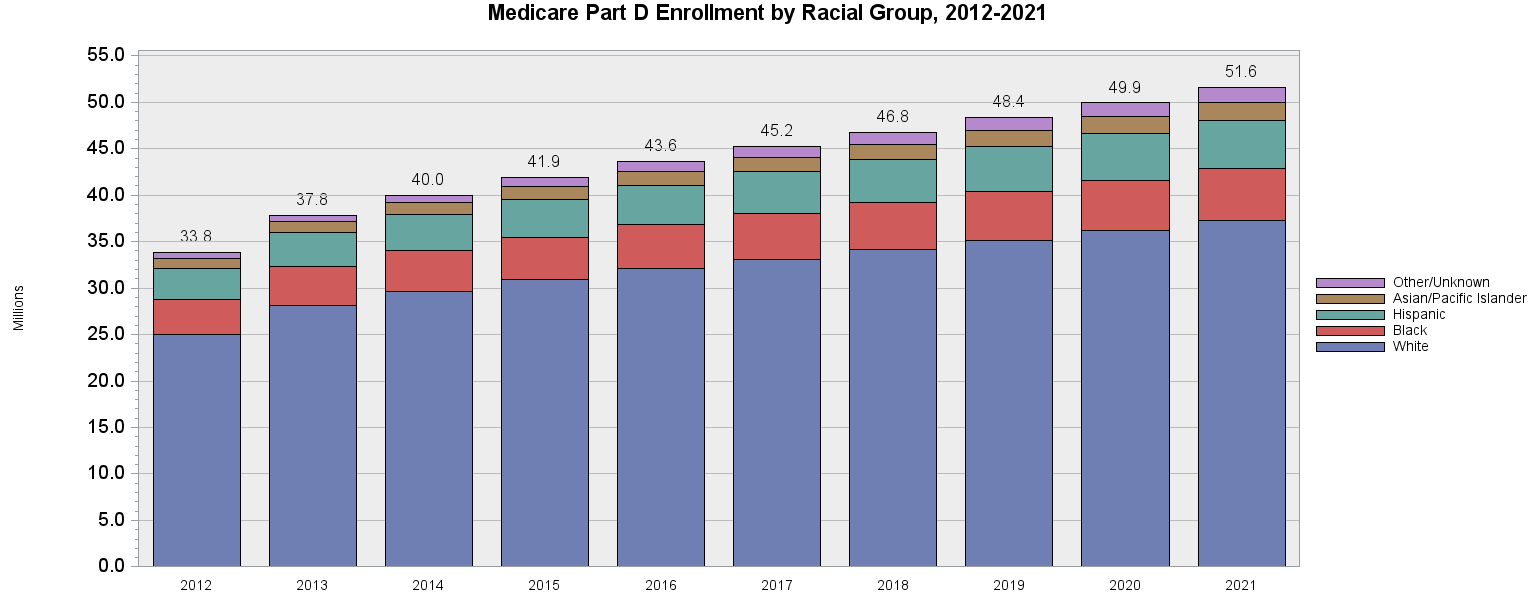
Medicare Part D Enrollment by Racial Group, 2013–2022
Description: The racial distribution of Medicare Part D enrollees has been stable over time. The white racial group comprises the largest proportion of Part D enrollees, by racial group (71.9% of Part D enrollees in 2022). The second and third largest groups are the Black and Hispanic racial groups (10.7% and 10.3% of all Part D enrollees, respectively).
Technical Notes: Medicare Part D coverage includes anyone with one month or more of Part D during the year. The Research Triangle Institute (RTI) race variable is used; American Indian, Native American, Other, and Unknown races are grouped together due to small cell sizes.
Chart Date: August 2024
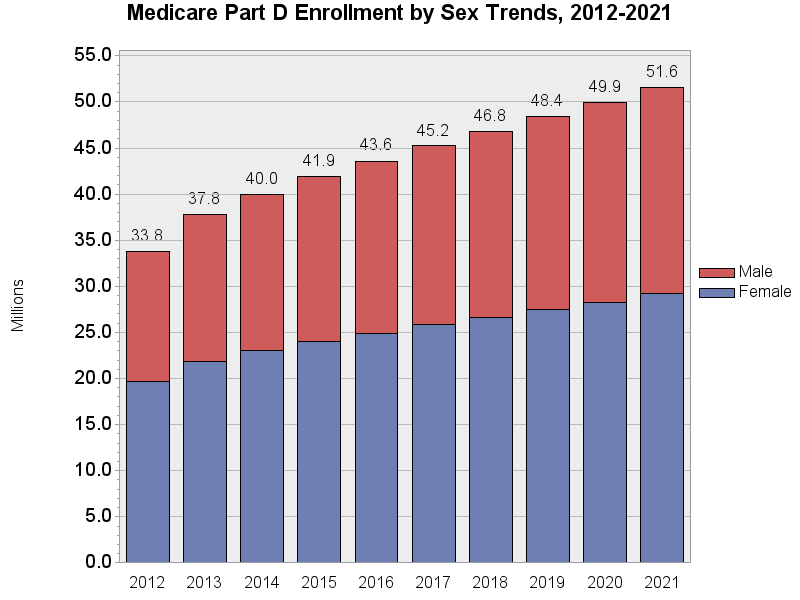
Medicare Part D Enrollment by Sex, 2013–2022
Description: Females accounted for 57.8% of all Medicare Part D enrollees in 2013. This proportion has declined slightly over time, to 56.5% in 2022.
Technical Notes: Medicare Part D coverage includes anyone with one month or more of Part D during the year.
Chart Date: August 2024
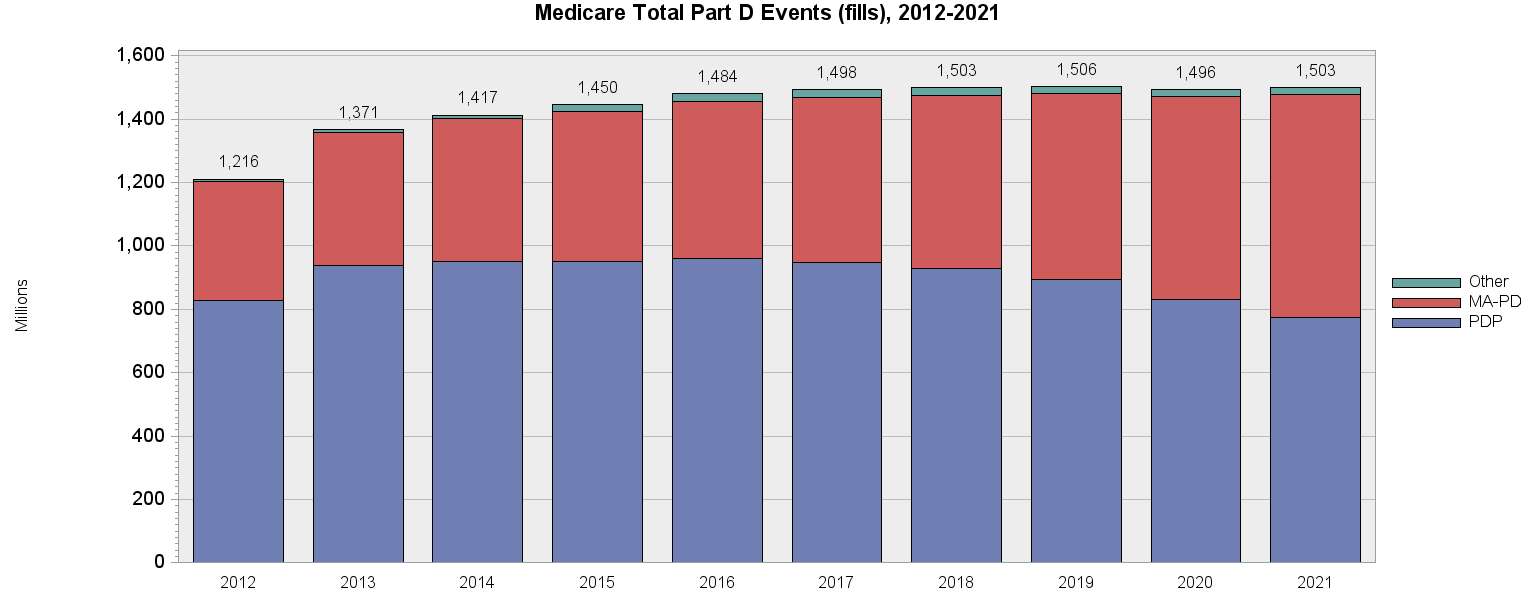
Medicare Total Part D Events (fills), 2014–2022
Description: For Medicare Part D, all Prescription Drug Events (PDEs) are present in the data — regardless of whether the beneficiary is enrolled in managed care or a fee-for-service plan. The total number of PDEs has increased over time from 1.417 billion in 2014 to 1.546 billion in 2022. There were fewer PDEs in 2020 than 2019; whereas the historical pattern showed an increase in total PDEs each year. The number of PDEs for MA-PD plans has increased as more beneficiaries have enrolled in MA-PD plans.
Technical Notes: Medicare Part D coverage includes anyone with one month or more of Part D during the year. PDEs are available for all filled prescriptions that are covered as part of the Part D benefit. Fills may consist of different quantities of the drug; no adjustment was made to account for fills which provided more than a 30-day supply. The "Other" plan type includes employer sponsored plans, national Program of All-Inclusive Care for the Elderly (PACE) and demonstrations.
Chart Date: August 2024
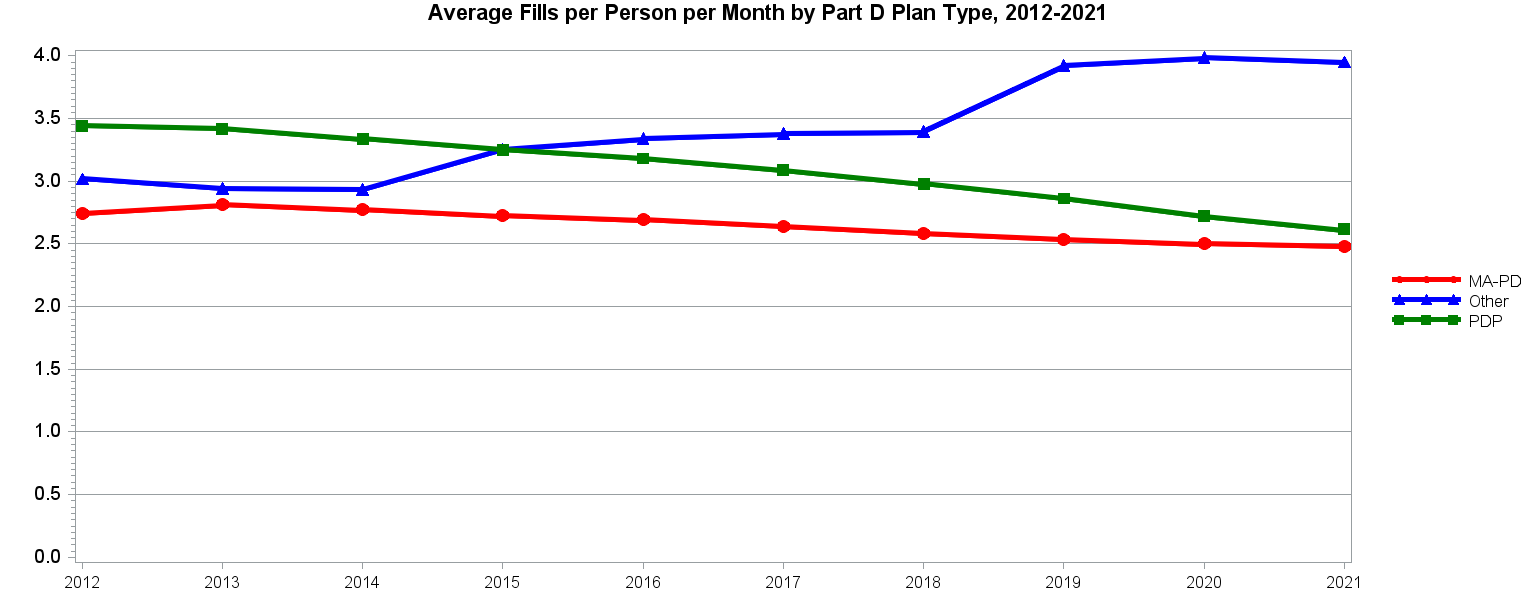
Average Part D Fills per Person per Month by Part D Plan Type, 2014–2022
Description: Medicare Part D enrollees may choose either a stand-alone prescription drug plan (PDP) or a managed care drug plan which includes wrap around medical coverage (i.e., Medicare Advantage [MA-PD]). Medicare also enrolls some beneficiaries in “Other” Part D plans. The average number of Prescription Drug Events (PDEs) per month for MA-PD plan enrollees was 2.8 fills per person in 2014 and has decreased slightly over time (to 2.5 fills per person per month in 2022). Historically, the average number of PDEs per month has been lower for those enrolled in MA-PD plans than for those enrolled in PDP plans. For PDP plans, the average fills per person per month has decreased from 3.3 in 2014 to 2.6 in 2022.
Technical Notes: Monthly Part D enrollment counts were used to calculate average number of PDEs per month. For Medicare Part D, all PDEs are present — regardless of whether the beneficiary is enrolled in managed care or a fee-for-service plan. PDEs are available for all filled prescriptions that are covered as part of the Part D benefit. Fills may consist of different quantities of the drug; no adjustment was made to account for fills which provided more than a 30-day supply. The "Other" plan type includes employer sponsored plans, national Program of All-Inclusive Care for the Elderly (PACE) and demonstrations.
Chart Date: August 2024
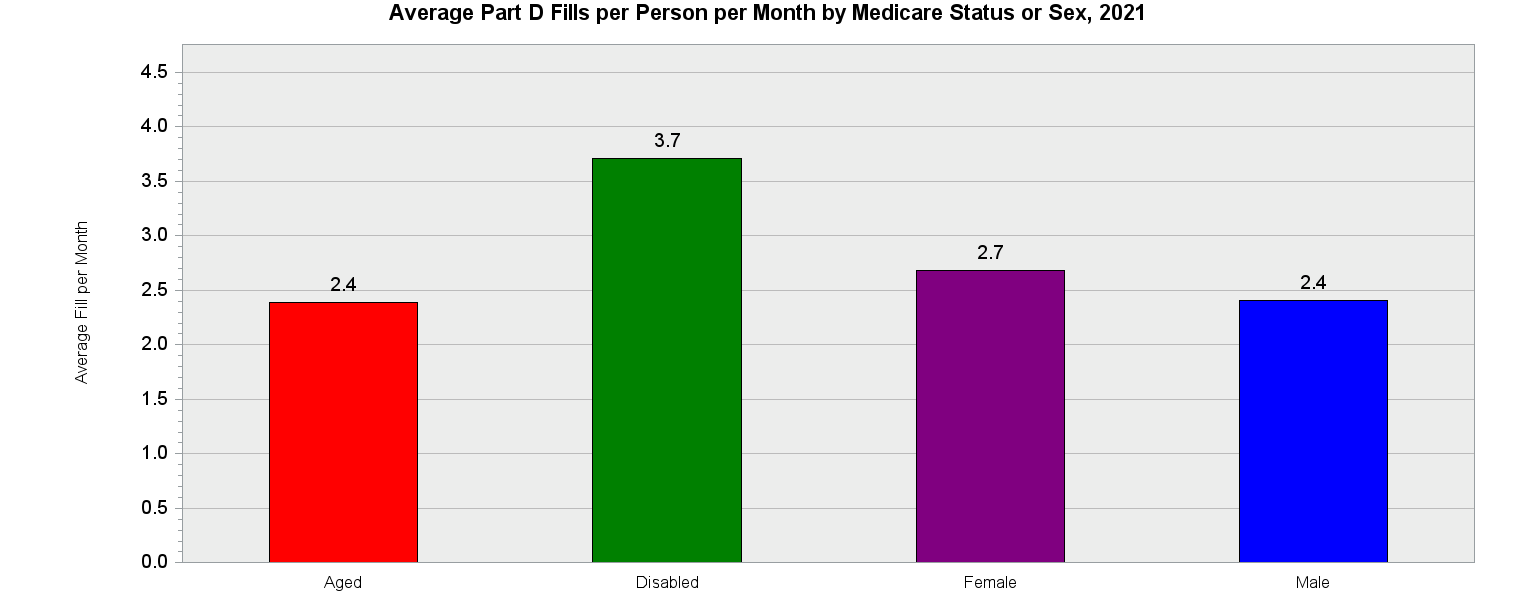
Average Part D Fills per Person per Month by Medicare Status or Sex, 2022
Description: The average number of Prescription Drug Events (PDEs) per month is shown for two variables on this graph by reason for enrollment in Medicare, as well as the sex of the beneficiary. The average number of drug fills per month is much higher for those enrolled in Medicare due to a disability rather than due to aging into the Medicare benefit (3.7 fills per month versus 2.4 fills per month, respectively). The average number of fills per month is higher for females than males (2.7 versus 2.4).
Technical Notes: Monthly Part D enrollment counts were used to calculate average number of PDEs per month. For Medicare Part D, all PDEs are present — regardless of whether the beneficiary is enrolled in managed care or a fee-for-service plan. PDEs are available for all filled prescriptions that are covered as part of the Part D benefit. Fills may consist of different quantities of the drug; no adjustment was made to account for fills which provided more than a 30-day supply. The reason for enrollment in Medicare classification used the Medicare status code, and combined end-stage renal disease (ESRD) and Disabled categories into the "Disabled" grouping.
Chart Date: August 2024

Average Part D Fills per Person per Month by Age Group, 2022
Description: The average number of Prescription Drug Events (PDEs) per month is shown by age group. The highest average number is for the youngest group, which likely reflects Medicare enrollment due to disability rather than age.
Technical Notes: Monthly Part D enrollment counts were used to calculate average number of PDEs per month. For Medicare Part D, all PDEs are present — regardless of whether the beneficiary is enrolled in managed care or a fee-for-service plan. PDEs are available for all filled prescriptions that are covered as part of the Part D benefit. Fills may consist of different quantities of the drug; no adjustment was made to account for fills which provided more than a 30-day supply. Age is calculated based on the age of the Medicare beneficiary as of December 31. If the beneficiary expired, the age is calculated based on age at time of death.
Chart Date: August 2024
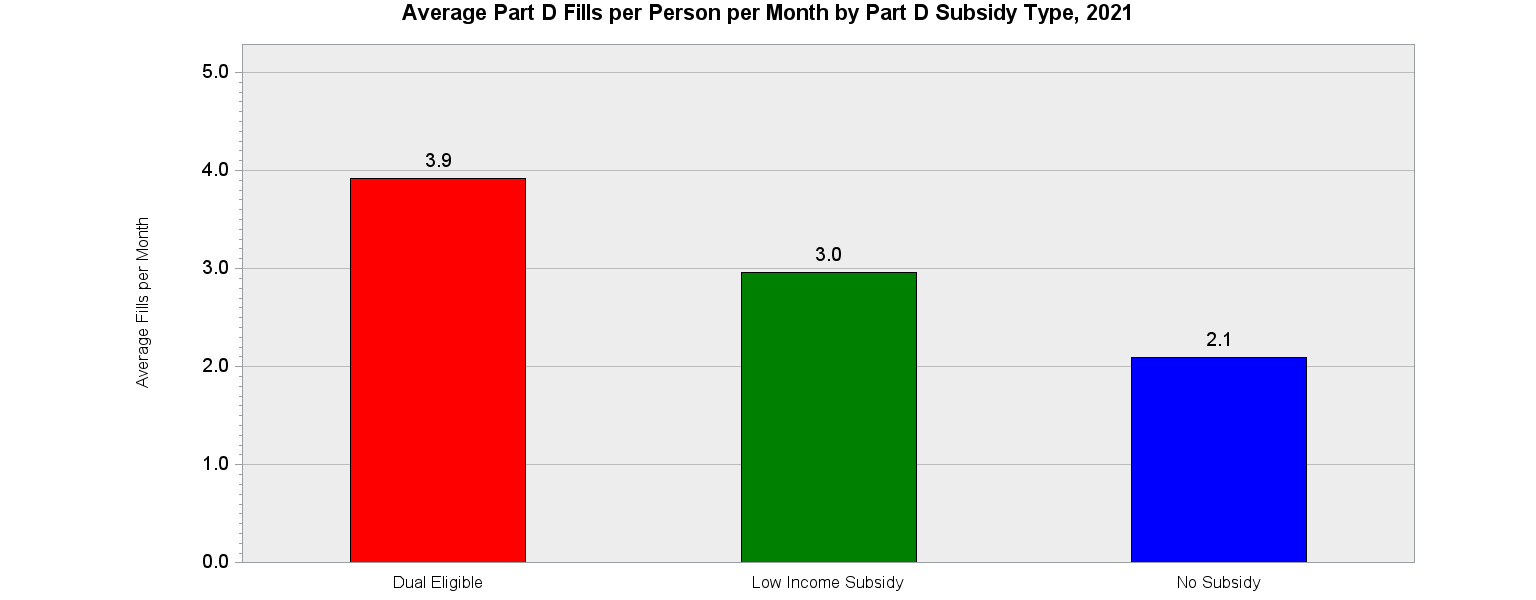
Average Part D Fills per Person per Month by Part D Subsidy Type, 2022
Description: The average number of Prescription Drug Events (PDEs) per month is shown by Part D subsidy status. Those classified as dually eligible (i.e., enrolled in both Medicare and Medicaid) have a much higher number of average monthly fills than those who have no subsidy. This is likely due to the Medicaid coverage requirements — including disability and medical need.
Technical Notes: Monthly Part D enrollment counts were used to calculate average number of PDEs per month. For Medicare Part D, all PDEs are present — regardless of whether the beneficiary is enrolled in managed care or a fee-for-service plan. PDEs are available for all filled prescriptions that are covered as part of the Part D benefit (note that some drugs may have been covered by Medicaid and not Medicare; these drugs are not included in these calculations). Fills may consist of different quantities of the drug; no adjustment was made to account for fills which provided more than a 30-day supply.
Chart Date: August 2024
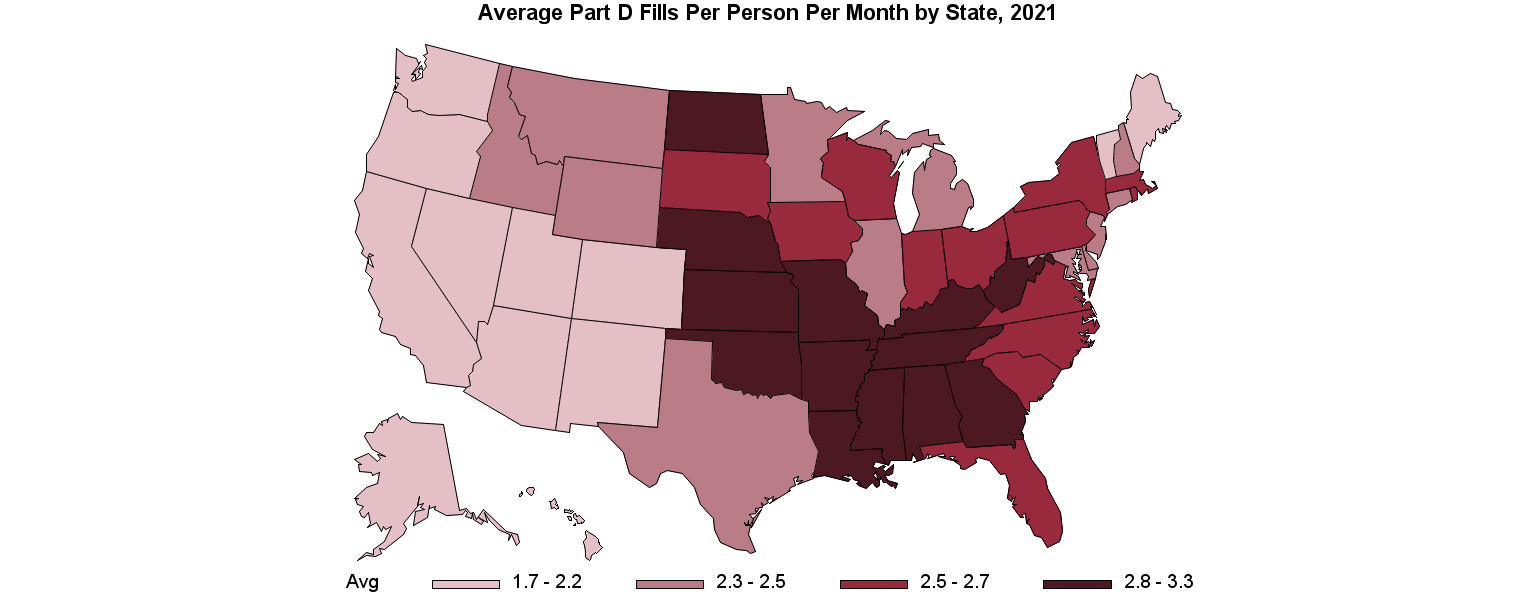
Average Part D Fills per Person per Month by State, 2022
Description: The average number of monthly prescription drug fills varies by state. Part D enrolled beneficiaries in Hawaii had the lowest average number of monthly fills (1.7), and Kentucky had the highest (3.3).
Technical Notes: Medicare Part D coverage includes anyone with one month or more of Part D during the year. All Medicare covered drugs were included in the count of drug fills. Fills may consist of different quantities of the drug; no adjustment was made to account for fills which provided more than a 30-day supply.
Chart Date: August 2024